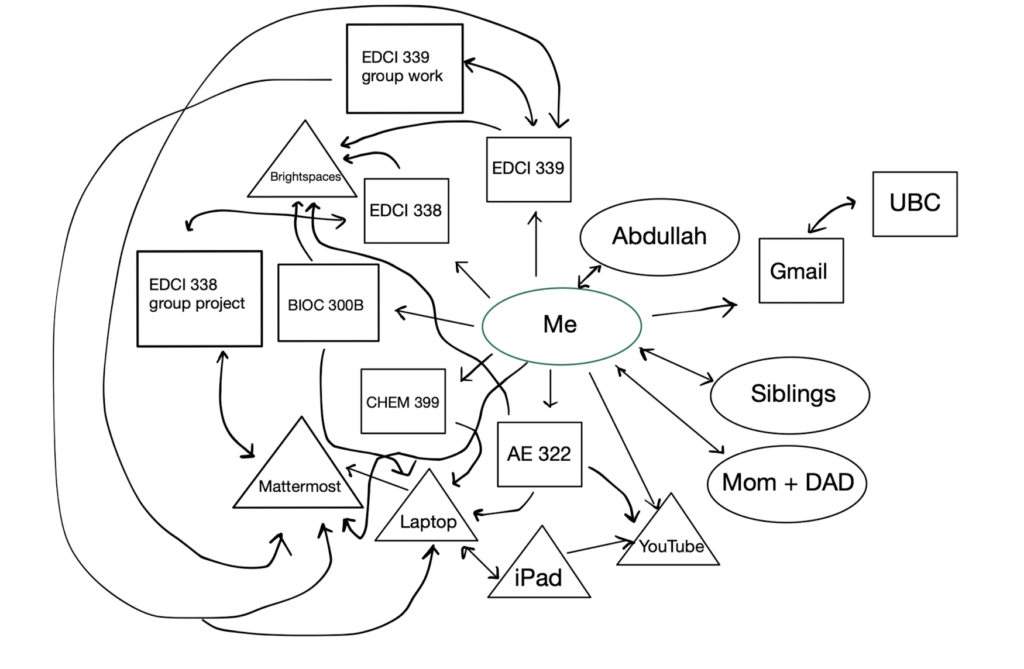
 Where do I start? Looking at my network map, I understand why I’ve felt overwhelmed lately. Real people were represented by cycles, courses by squares, and technology by triangles. I wanted these elements to be close together to show how I feel surrounded by numerous things simultaneously. First, let’s focus on the cycles. I placed my fiance, Abdullah, parents, and siblings close to me, symbolizing a strong connection with them. Communication with my fiance is frequent due to our long-distance relationship, mostly through digital means like phone calls and texts. It’s in person with my sibling and parents as we live together. Abdullah is placed closer to me than my parents to represent the higher frequency of our conversations despite living together. UBC is connected in one direction to indicate the paperwork I must complete to start Pharmacy school in September. The communication with UBC is primarily digital through Gmail. Next, the square represents my courses. This semester is my last term at UVic, explaining why I’m taking multiple classes. Three classes are condensed and require weekly project submissions; the other two span three months. BIOC 300B, a biochemistry course, is crucial for my degree, and it’s connected to my laptop, where I take notes, and to Brightspaces, where the instructor posts lecture notes. This class is in-person, and I attend three times a week for 90 minutes each session. I’m also taking two EDCI classes, EDCI 338 and 339, which involve group project assignments I’ve been working on recently. Both EDCI classes are delivered online asynchronously through the Mattermost application, indicated by the large space between them and Mattermost. The two-way connections between EDCI group projects and Mattermost highlight their interdependence. AE 322, Digital Art, is an online asynchronous course for three weeks, and I linked it to YouTube and my laptop, which are my companions while studying this subject. Finally, I have a special connection with CHEM 399, a research experience class, as it’s my first time taking a research-focused course. It had both physical and digital components, involving weekly meetings with the supervisor and remote data analysis, hence its proximity to both me and my laptop. Overall, this network map reflects the complexity of my commitments and the various ways I interact with people, courses, and technology, illustrating the sources of my current feelings of overwhelm.
Reflection
This activity provided me with a better understanding of myself. Being a visual learner allowed me to gain insights into my life’s various connections. The visual representation of my course load made me aware of my weekly commitments, prompting me to consider my time management and balancing my responsibilities. Furthermore, the map highlighted the significance of my connections within my academic journey, revealing how interactions with instructors, peers, and study resources impact my learning experience.